
Deeper insights. Maximum impact, with Macrobond
The most comprehensive database of aggregate macroeconomic and financial data globally, integrated with analytical tools for swift analysis, visualization and sharing of insights.
Purchase Macrobond
Data Management
Statistics
Graphics
What is Macrobond
Macrobond delivers the world’s most extensive macroeconomic and financial data alongside the tools and technologies to quickly analyse, visualise and share insights – from a single integrated platform.
Analyse & visualise
Use our built-in calculations, models and charting tools to generate analyses visualised through beautiful, dynamic charts and tables
Source & synthesise
Enhance our extensive universe of macroeconomic, aggregate financial and sector time-series data with third-party and proprietary data
Collaborate & share
Share your insights across and beyond your organisation so others can build on your research.
Develop a single source of truth – together
Seamlessly integrate all your data sources
Macrobond’s desktop application is a single source of truth for all your data needs. In addition to our core database, the platform can also provide a direct connection to third-party premium providers and even your own proprietary and internal data. By putting a world of intelligence at your fingertips, we empower you to make more informed investment decisions, more quickly.
Accelerate the journey from data to decision
Macrobond’s integrated analytics and data visualisation tools streamline the process of building and updating charts and tables, saving you hours of repetitive work manually creating and recreating assets each time new data is released. By automating routine tasks and simplifying workflows, we enable you to spend less time organising data and more time producing valuable insights.
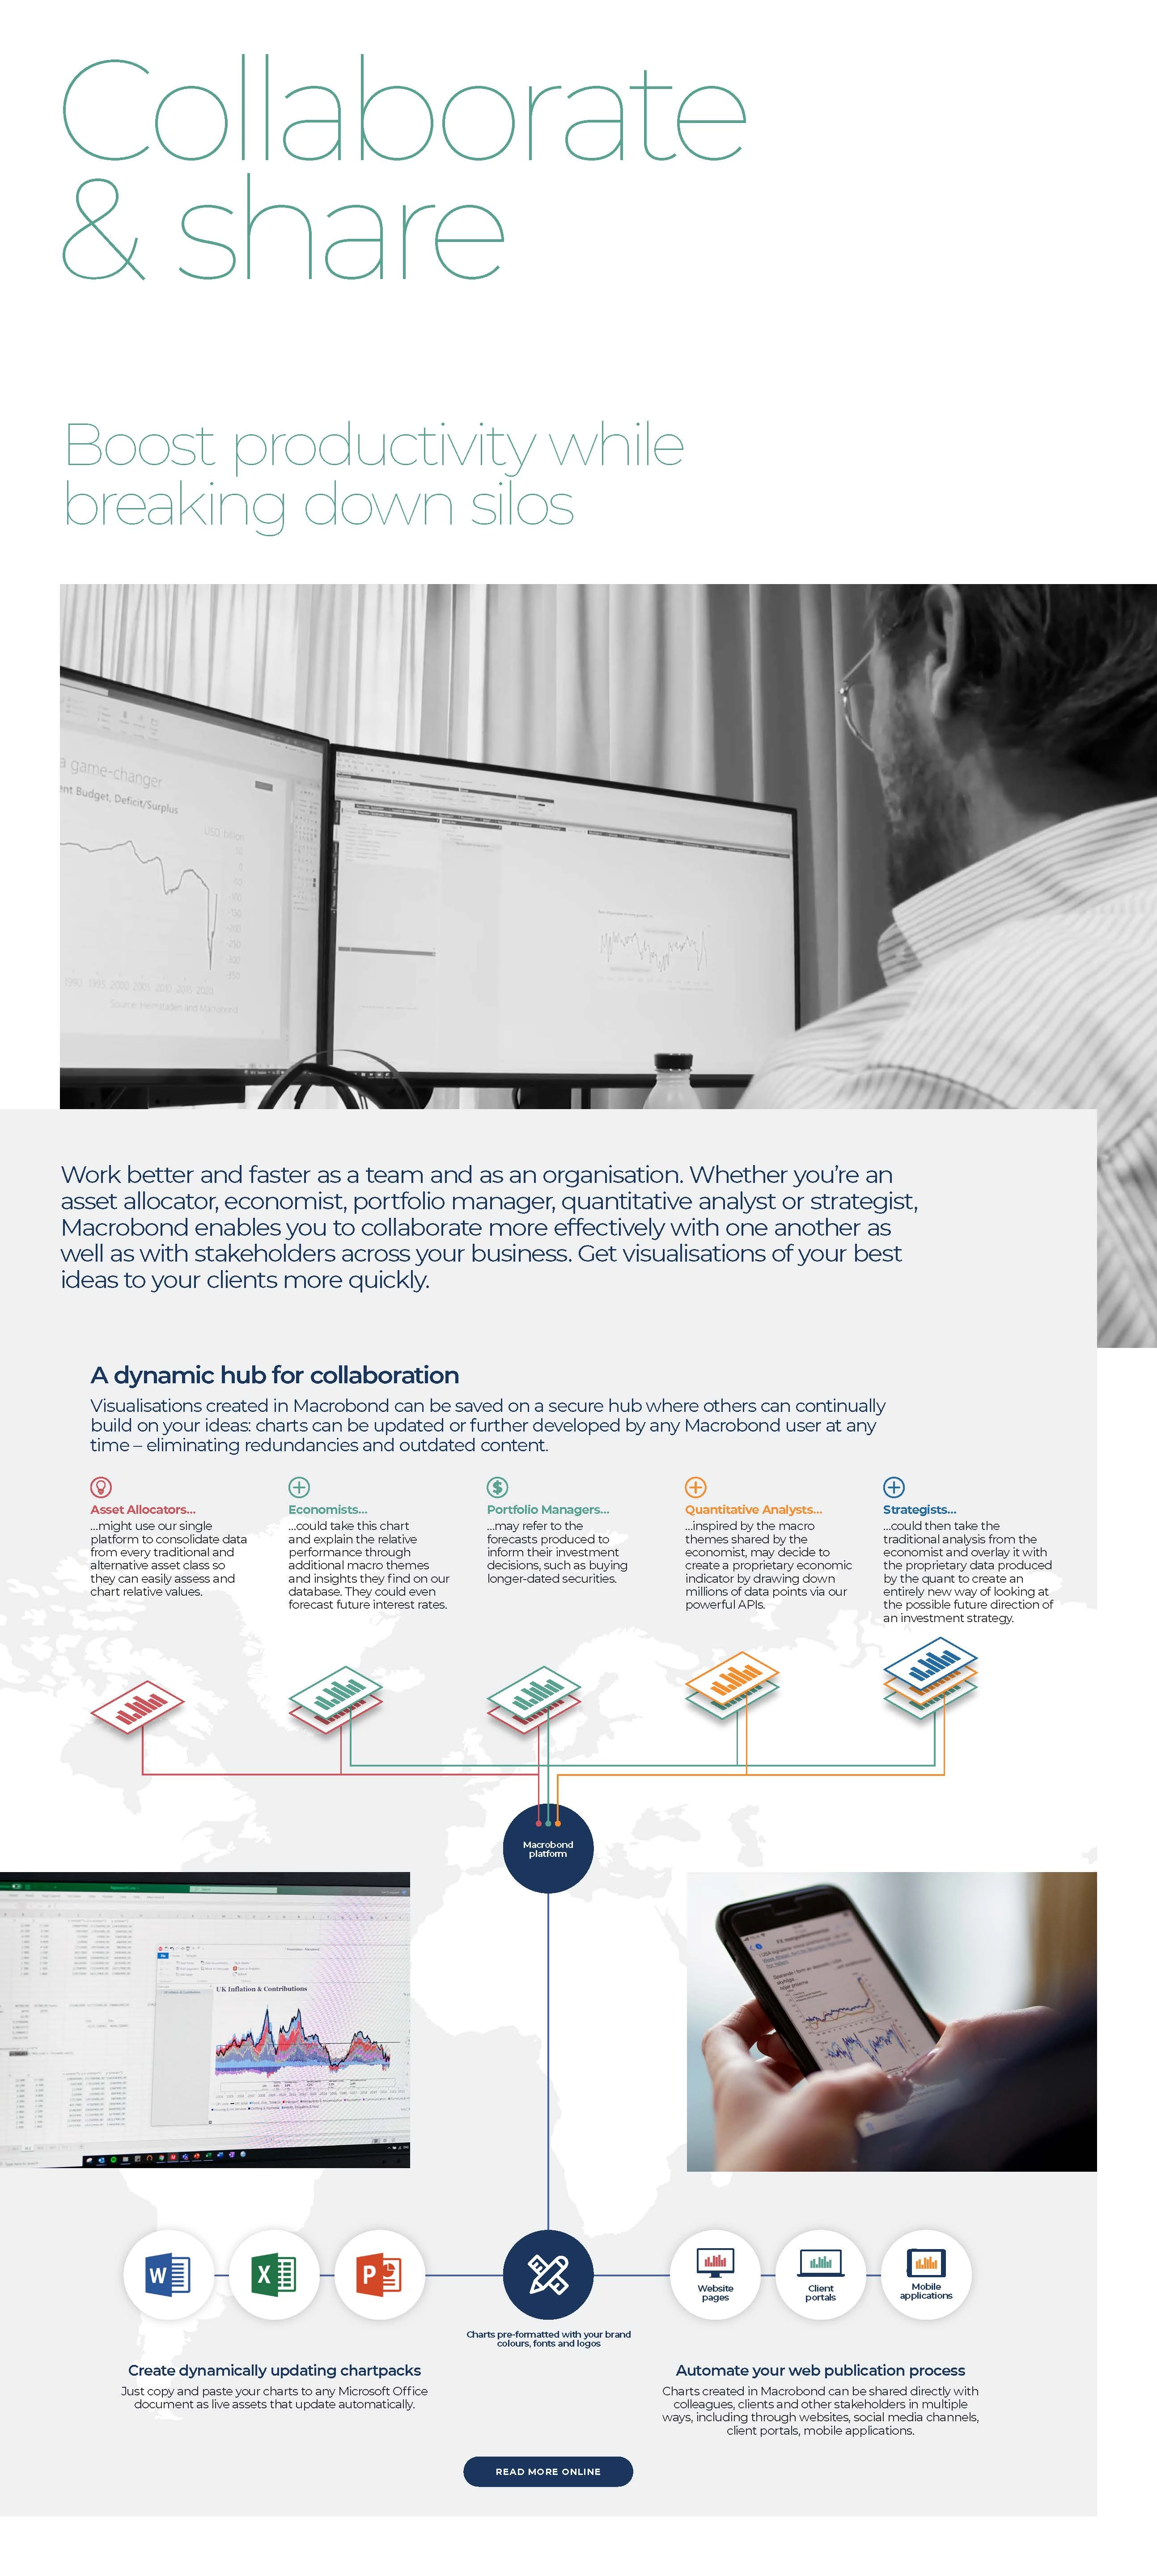
Boost productivity while breaking down silos
Work better and faster as a team and as an organisation. Whether you’re an asset allocator, economist, portfolio manager, quantitative analyst or strategist, Macrobond enables you to collaborate more effectively with one another as well as with stakeholders across your business. Get visualisations of your best ideas to your clients more quickly.
Core
The most comprehensive database of aggregate macroeconomic and financial data globally, integrated with analytical tools for swift analysis, visualization and sharing of insights.
Key Benefits
-
Comprehensive metadata
-
Logical data structure
-
Instant calculations, modelling and forecasting
-
Internal/external database integration
-
Two-way connections to Microsoft Office
Data+
All the benefits of Core, plus access to unlimited data mining for your econometric and quantitative analyst teams.
Key Benefits
-
Unlimited time series downloads
-
APIs to Python, R, MATLAB and EViews
-
33m+ point-in-time series with revision history
Viewer
Provide colleagues without a Core or Data+ subscription live access to the dynamic charts created by your in-house research teams.
Key Benefits
-
Receive charts by email, text or instant message
-
Fully compatible with Microsoft Office
-
Charts update automatically with new data releases
Real-world customer success stories
SpareBank 1 Markets | Harald Andreassen
Swiss Re | Hendre Garbers
Skandinaviska Enskilda Banken SEB | Carl Hammer
The Bulletin
-
More
-
 More
MoreGreenflation or Transformation? Unpacking Energy Prices in the Transition Era
-
 More
MoreIs the World Heading for a Soft Landing in 2026?
-
 More
MoreA Generation at Risk: The Realities of Youth Unemployment in Europe and the UK
-
 More
MoreRebuilding Economies After Natural Disasters: What Does The Data Say?
-
 More
MoreAI’s Hidden Cost: The Unanswered Question of Energy Consumption